NOTICE: The below is an outdated article about Chrome devtools plugins. It is not up to date.
So I wanted to create a Chrome devtools plugin. Scraping the Building a Chrome Extension developer page a couple of weeks ago, I found out that chrome.devtools.panels is available. I hadn’t looked into extension development much since creating the Googlevich extension, which is an artwork of which I do not know wether it still works, so I was happily surprised to see a devtools api!
But what for? Why do I want to extend the devtools when you already can do so much with it? Why would I add stuff to the great and continuous improving tools for front-end developers already made by the Chrome team?
Well, first of all, I noticed that I kept googling for stupid transformers like online URL encoders and decoders, that I used PHP in Terminal to get the base64 representation of a UI image, and so on and so forth. Why not have them available where all the other tools are available? And why not search Chrome Web Store to find Browser or Page Actions that can do it for me?
Well, during development, I’d like to keep as much extensions off as possible. There’s just too much fuzz and clutter around the Chrome UI, or within the Sources panel of devtools, or additional event handlers attached to your document to get a clear grasp of what’s going on while debugging.
So first of all, I’d like to create a devtools plugin to be able to turn off plugins like Utime, SchemaDump (true, this one is quite a bunch of spaghetti code) or CSS Reloader. I’ll probably use ideas of aforementioned plugins but will implement them the way I’d like to see them implemented.
So upcoming weeks you’ll see a series of blog posts about creating and extending a custom devtools plugin. Wether it’ll be available in Chrome Web Store, I don’t know yet, but at least, the code is in GitHub so you can check it out yourself. Get, use and improve the code freely!
One note on the name: the company I used to work for, with the beautiful name Strawberries, has merged with another one, SoftLution, into Osudio. This to me looked like a good opportunity to transform ideas into code and serve them as a present.
The following will show you how to setup a very, very basic devtools plugin: the bare minimal. The directory structure is as follows:
├─ manifest.json
├─ js
│  ├─ devtools.js
├─ html
│  ├─ devtools.html
│  ├─ panel.html
First of all, a manifest.json file.
{
  "manifest_version": 2,

  "name": "Osudio Dev Tools",
  "version": "0.1",

  "description": "Frontend Developer Tools for Osudio",
  "author": "Osudio Frontend Team",

  "devtools_page": "html/devtools.html"
}
Much of this is quite self-explanatory, the full reference can be found at developer.chrome.com. As you can see, you define an html file as devtools page: /html/devtools.html. This page only needs to contain a script, from which you will create the panel.
<html>
<head>
<script src="/js/devtools.js"></script>
</head>
</html>This is the content of devtools.js.
chrome.devtools.panels.create('Osudio', null, '/html/panel.html', null);For now, no callback is needed. We just want to create the panel and handle all logic over there. So the chrome.devtools.panels.create method gets a reference passed to an HTML file which will be our document within the panel.
<html>
<head></head>
<body>
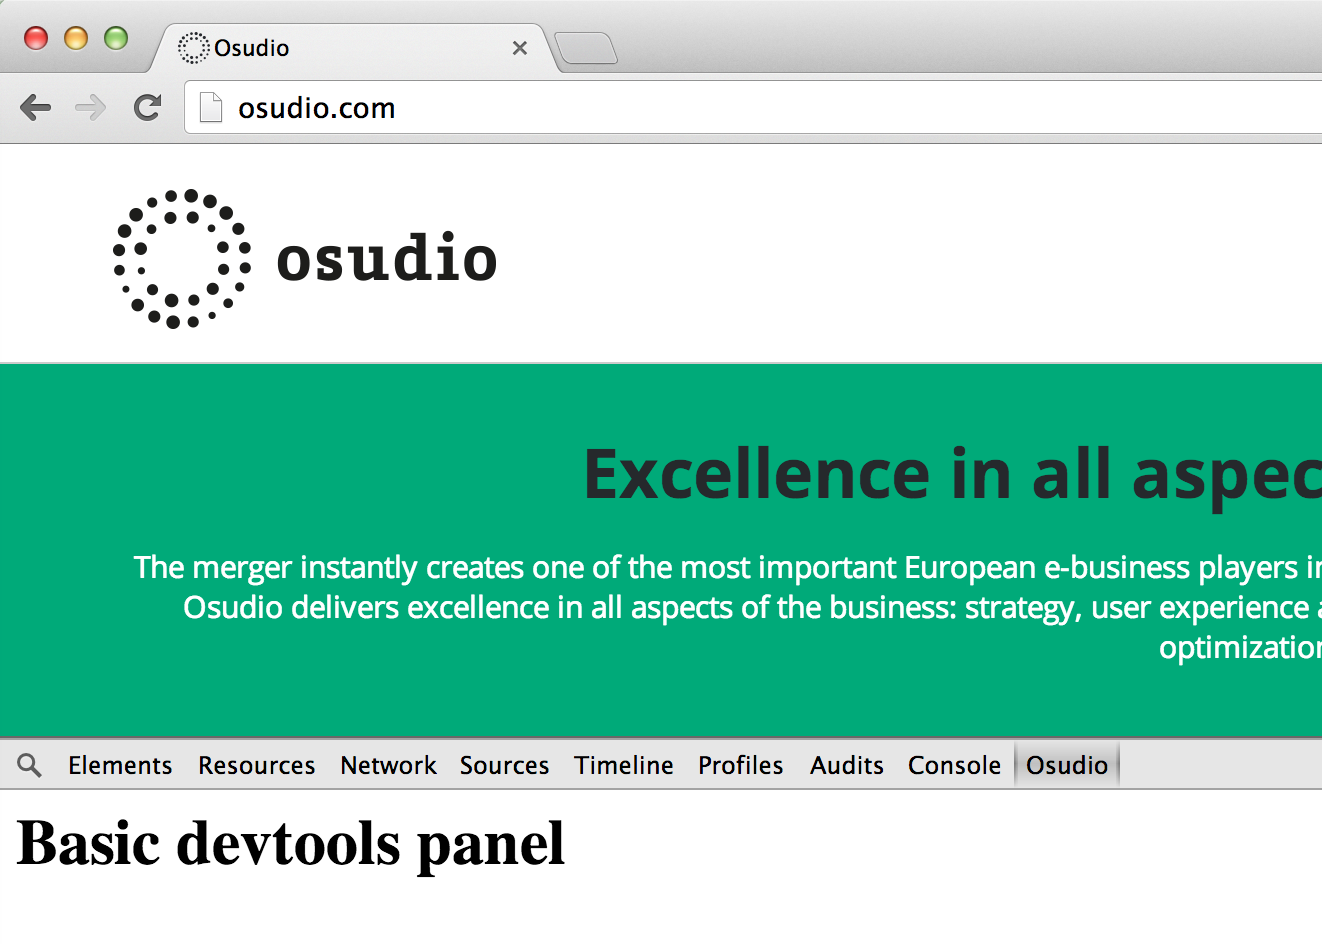
<h1>Basic devtools panel</h1>
</body>
</html>That’s it for now. If you want to see wether your extension works, open up Chrome and go to chrome://extensions/. There you should check the checkbox for Developer mode. This will show a couple of buttons. Click Load unpacked extension... and point the file selector that appears to the root of your extension’s code. If you have made a syntax error in your manifest.json file, Chrome will immediately inform you about that.
Now when your extension showed up in the list, verify if it is enabled, if not, check checkbox. Now open up a website and open the developer tools by either using Cmd-Alt-i (Mac), or the Windows equivalent or go in the menu to View -> Developer -> Developer tools. Your panel should be part of the list of tabs, added after the Console tab.